


How to use AI for Predictive Maintenance
AI Powered Predictive Maintenance
AI-powered predictive maintenance helps prevent equipment failures by analyzing real-time machine data. This technology is crucial for modern industries, as it can detect problems before they cause expensive breakdowns. Recent company failures highlight this importance, where Altera Infrastructure filed for bankruptcy in 2022 due to heavy debt and operational inefficiencies from poor equipment maintenance, while Cineworld accumulated nearly $5 billion in debt partly due to inefficient theater maintenance and equipment breakdowns. Similarly, Kingfisher Airlines collapsed under high maintenance costs and frequent technical issues that led to flight cancellations. By implementing AI maintenance systems, companies can better protect their operations and avoid similar financial disasters and public institutions like Indian Railways, which has encountered accidents due to poor track and rolling stock maintenance which shows the critical need for AI solutions to predict and address maintenance needs proactively.
What is Predictive Maintenance (PdM)?
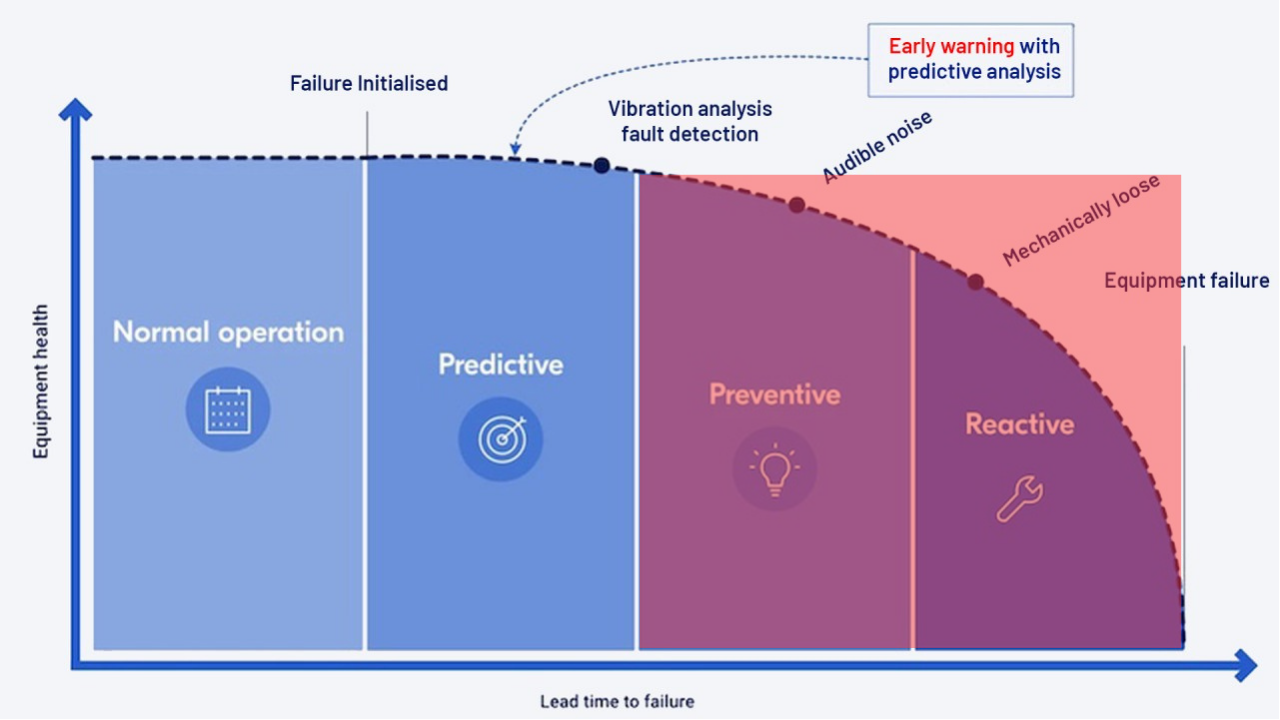
AI-powered predictive maintenance (PdM) leverages real-time data and analytics to predict potential equipment failures, reducing unplanned downtime and extending machinery lifespan by addressing issues before they escalate. This approach marks a shift from traditional reactive and preventive maintenance, which either waits for breakdowns or follows routine schedules without regard to actual equipment condition.
PdM’s importance is highlighted by success stories from companies like PepsiCo's Frito-Lay, Noranda Alumina, and San Diego Gas & Electric (SDG&E), each of which harnessed PdM to avoid costly interruptions and achieve impressive efficiency gains. For example, Frito-Lay's Tennessee plant prevented equipment failures through vibration and ultrasound analyses, while SDG&E's AI-driven PdM program accurately predicted failures in underground assets, showcasing the utility of condition-based monitoring over outdated methods as covered in the source. Predictive maintenance can significantly improve asset management by foreseeing issues and optimizing maintenance schedules, saving companies millions in potential losses and ensuring higher operational continuity and safety across sectors like manufacturing, energy, and transportation.
Why Predictive Maintenance?
Predictive Maintenance (PdM) is revolutionizing asset management by delivering substantial cost savings, maximizing equipment reliability, reducing unplanned downtime, and extending the lifespan of critical assets. Unlike traditional maintenance methods, PdM uses advanced analytics and real-time monitoring to perform maintenance only when truly necessary, optimizing both efficiency and operational costs.
By leveraging technologies such as IoT sensors, machine learning algorithms, and big data, PdM provides actionable insights into asset health. This proactive approach not only minimizes the risk of sudden failures but also enhances safety, improves resource allocation, and ensures better compliance with industry regulations. Organizations adopting PdM are witnessing transformative results, driving competitiveness in an increasingly dynamic market landscape.
Cost Savings and Equipment Reliability
PepsiCo’s Frito-Lay facilities leveraged PdM to gain over 4,000 additional hours of annual production, effectively translating into millions of pounds of extra product without the cost burden of unexpected part replacements. By minimizing unexpected breakdowns and proactively addressing minor issues, Frito-Lay maximized asset reliability and optimized production capacity across its operations.
Reduction in Unplanned Downtime
According to a study by Deloitte, predictive maintenance can increase equipment uptime by as much as 20% and reduce overall maintenance costs by 10%. Companies that adopt PdM often experience significant reductions in unplanned downtime, which can lead to substantial cost savings. For instance, a leading offshore oil and gas operator introduced a sophisticated PdM system across nine platforms, achieving an average reduction in downtime of 20% and increasing production by over 500,000 barrels of oil annually reported in mckinsey.
Enhanced Operational Efficiency
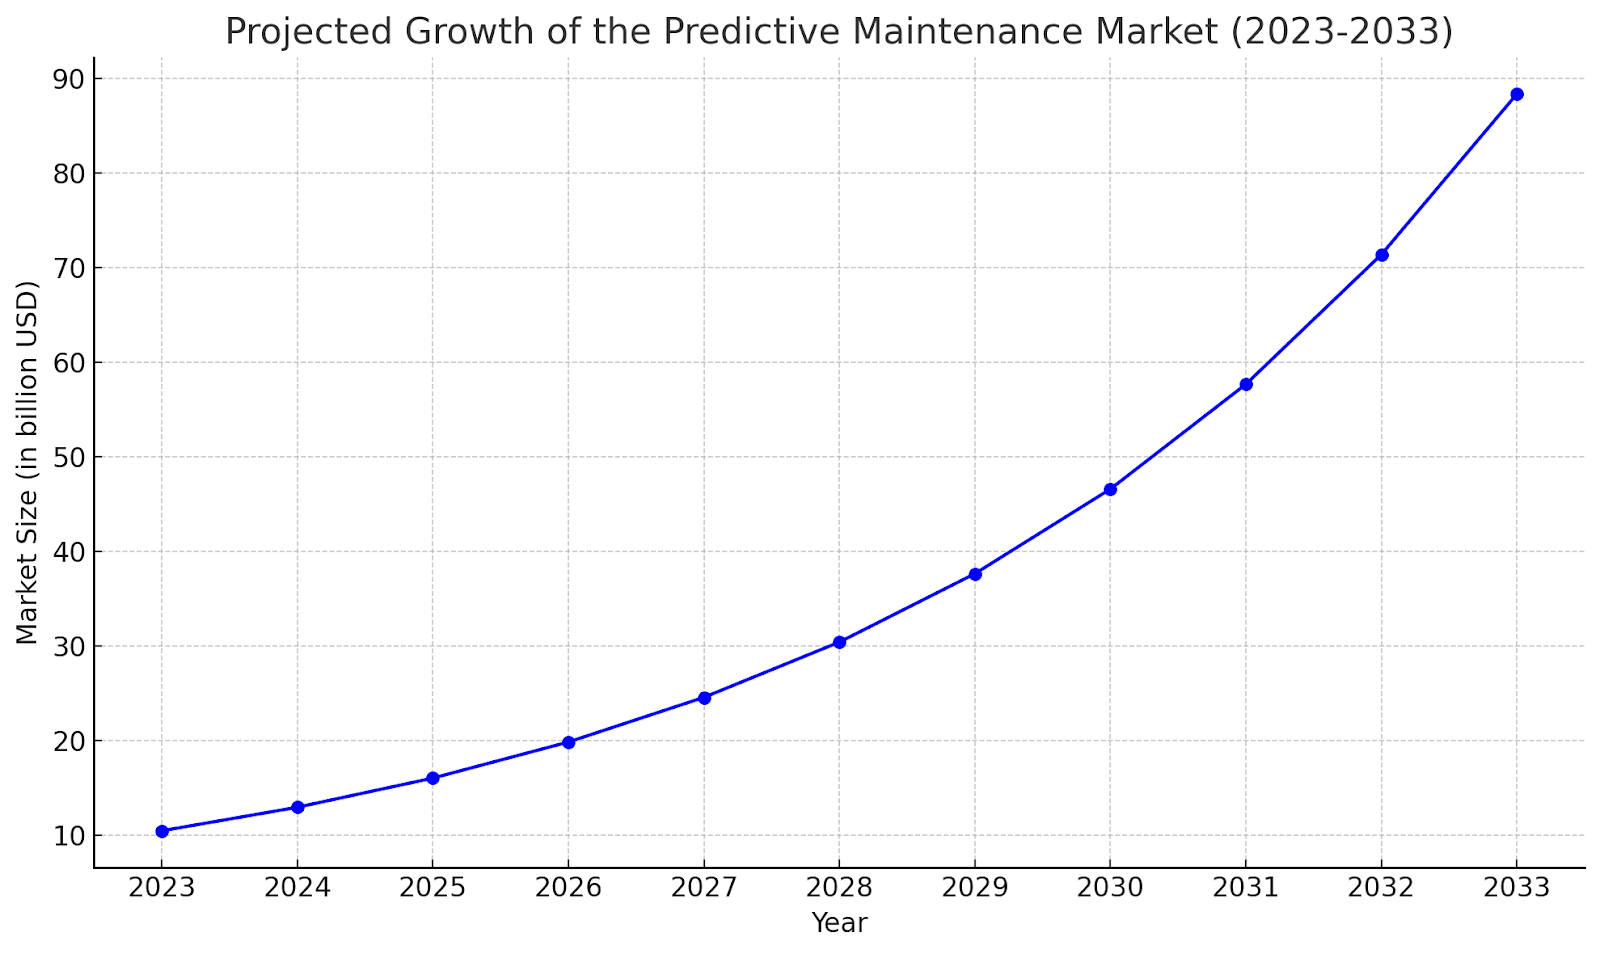
Predictive maintenance optimizes maintenance schedules based on real-time data analysis. This proactive approach allows companies to schedule maintenance during planned downtimes or low-demand periods, maximizing asset availability. For example, a global chemicals company saw a 30% productivity boost in maintenance planning and scheduling after implementing a digital work management system, underscoring PdM’s role in enhancing operational efficiency reported in mckinsey. Companies across industries are increasingly recognizing PdM’s value, driving the market’s growth at a projected CAGR of 23.77%, with an estimated value of $10.47 billion in 2023. This surge in adoption is powered by advancements in IoT, AI, and machine learning, making predictive maintenance indispensable for ensuring uptime, reliability, and cost-effectiveness in critical sectors like manufacturing, energy, and transportation reported in source.
Techniques for Predictive Maintenance
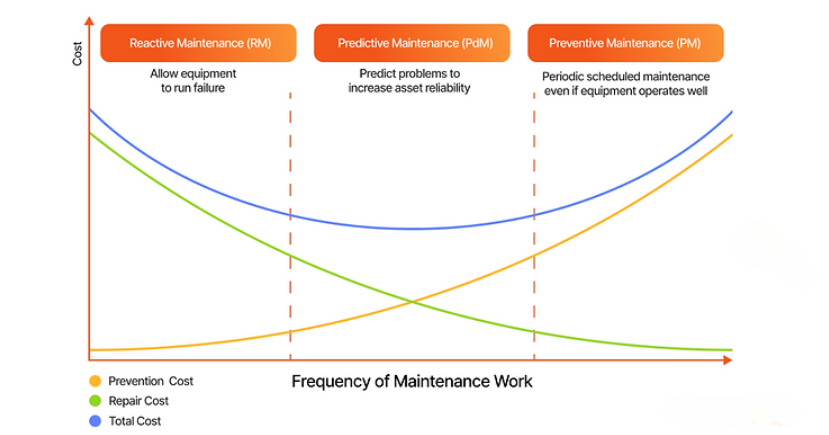
Reactive Maintenance
Reactive maintenance is the earliest form of maintenance strategy, addressing equipment issues only after they occur. This "run-to-failure" approach often leads to unexpected downtime and costly repairs. Historically, reactive maintenance was the standard practice before the development of more structured strategies like preventive maintenance. Without anticipating or preventing issues, equipment was simply repaired or replaced after failure, which could cause significant disruptions, particularly in critical operations.
As industries grew and equipment complexity increased, the limitations of reactive maintenance became apparent, paving the way for preventive maintenance. This strategy introduced scheduled upkeep to mitigate unexpected failures, thus improving reliability and extending asset life.
Anomaly Detection
Anomaly detection in predictive maintenance identifies irregularities in real-time equipment data, enabling early intervention before issues escalate. Techniques for anomaly detection include statistical analysis, time series analysis, and pattern recognition, utilizing both supervised and unsupervised machine learning methods. For instance, statistical approaches such as Z-score analysis flag unusual deviations in sensor readings, while time series models like ARIMA and deep learning architectures like LSTM networks are valuable for detecting complex temporal patterns in machine data. Pattern analysis further examines operational sequences, identifying deviations that may signal mechanical wear or impending faults.
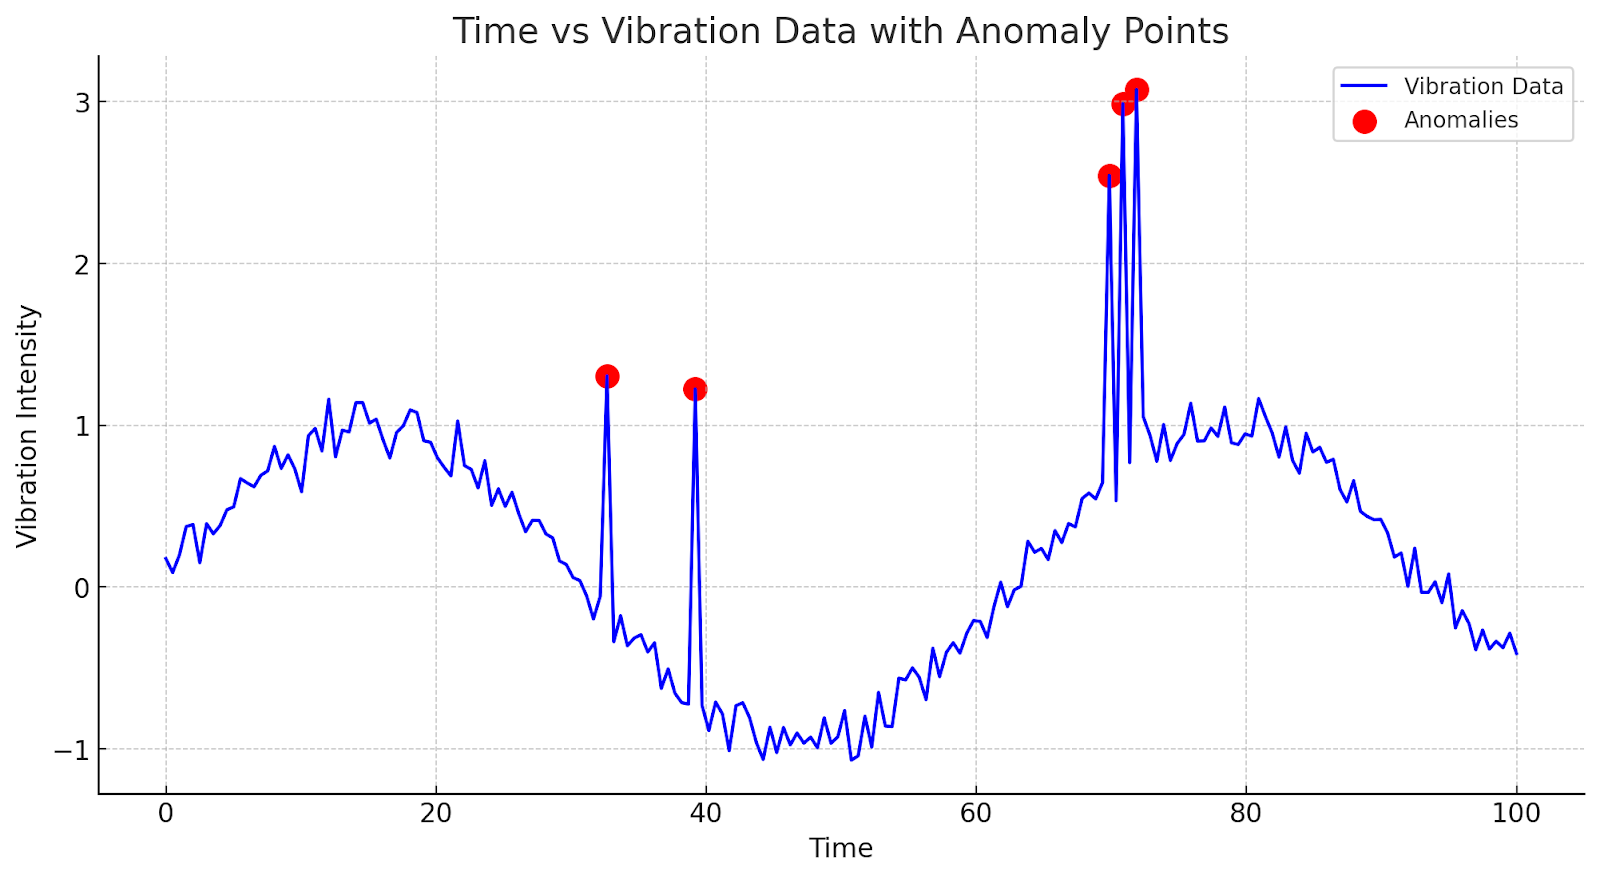
Here’s an example graph showing vibration intensity over time, with red markers indicating anomaly points. This illustrates how certain data points deviate significantly from the regular pattern, serving as potential indicators of abnormal equipment behavior in predictive maintenance.
Condition-based maintenance (CBM)
Condition-based maintenance (CBM) is a proactive strategy that schedules maintenance actions based on real-time equipment monitoring. Sensors capture key parameters like vibration, temperature, pressure, and acoustic signals, which are continuously analyzed to detect wear or deterioration. When these readings indicate a decline in performance, CBM triggers maintenance, minimizing downtime and extending equipment lifespan. Unlike preventive maintenance, which operates on set schedules, CBM responds to the actual health of equipment, optimizing resource use and reducing unnecessary interventions.
CBM employs several survival analysis algorithms to predict equipment failure and better understand maintenance timing:
Kaplan-Meier Survival Analysis
The Kaplan-Meier survival analysis is a non-parametric method used to estimate the probability of equipment survival over time. This model helps maintenance teams assess the likelihood of equipment operating without failure over specific periods, making it particularly useful for planning maintenance activities based on potential failure points in the equipment's life cycle.
Consider an example scenario, a company monitors the operational lifespan of its instruments, tracking the number of days each instrument remains operational before either failing or continuing beyond the observation period. The sample data includes operational days [120, 200, 95, 150, 240, 180, 300, 210, 130, 275] and corresponding failure events [1, 0, 1, 1, 0, 1, 1, 0, 1, 1], where 1 indicates a failure and 0 represents censoring (the instrument continued functioning).
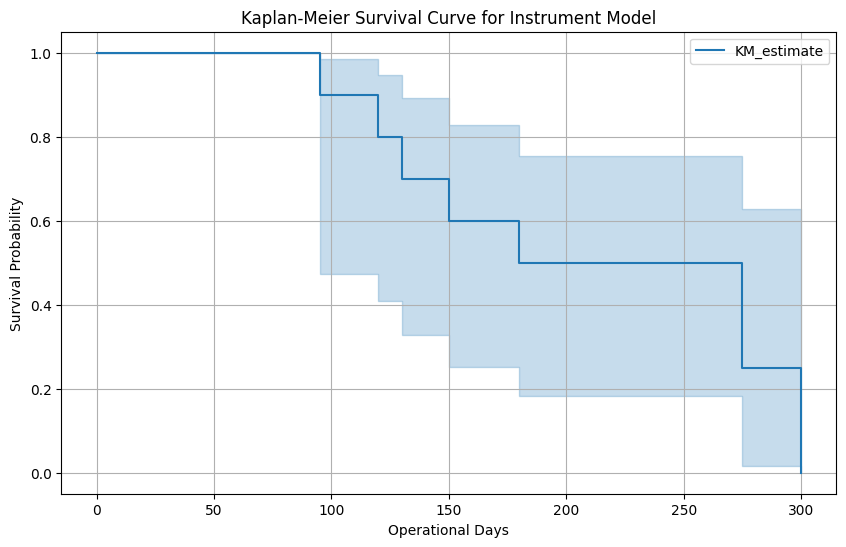
The Kaplan-Meier survival curve generated from this data illustrates the probability of instrument survival over time. The curve shows a steep decline in survival probability after around 100 operational days. At approximately 120 days, about 90% of the instruments are still operational, but this probability sharply declines between 100 and 200 days, reaching around 60% by 200 days. Beyond 200 days, the survival probability drops further, approaching zero by around 275 days, suggesting that most instruments are expected to fail within this timeframe.
Strategic Insights
Based on this analysis, the company can take several proactive steps:
- Schedule preventive maintenance activities around the 100-day mark to address potential failures before they become critical.
- Allocate budget for replacement or repair costs as instruments are likely to require attention beyond 200 operational days.
- Inform end-users and stakeholders about expected equipment performance over time to set realistic expectations for the operational lifespan of the instruments.
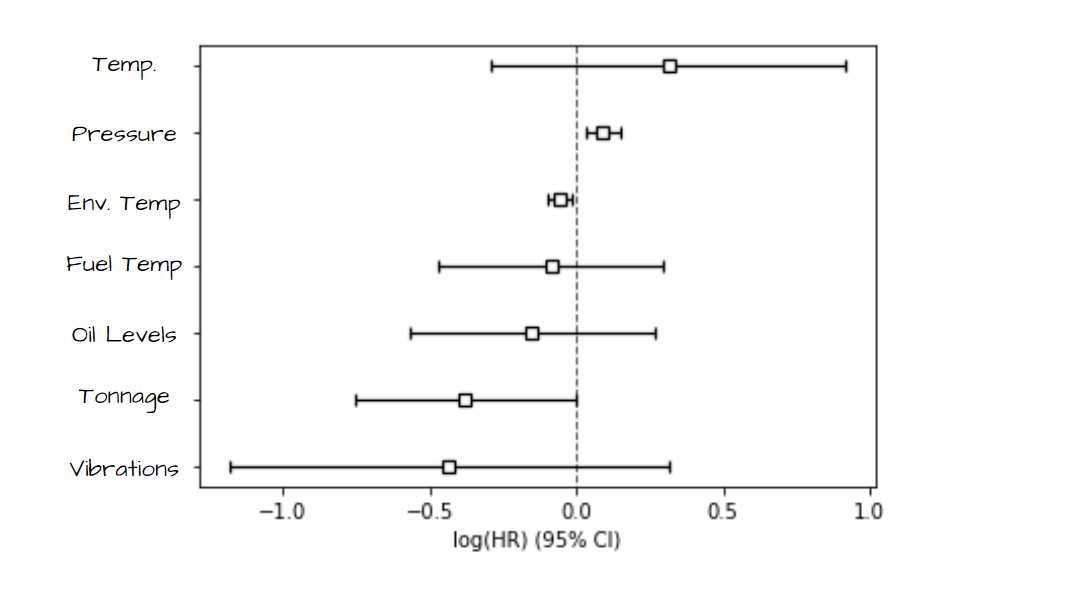
Cox Proportional Hazards Model
The Cox Proportional Hazards Model is a statistical technique widely used in predictive maintenance to evaluate how different conditions impact equipment failure over time. Unlike the Kaplan-Meier method, which focuses on estimating survival probability for a single variable, the Cox model accommodates multiple factors, making it particularly suitable for condition-based maintenance (CBM). This model can incorporate variables such as temperature, vibration level, and operation frequency, providing a nuanced understanding of how each factor affects the likelihood of equipment failure.
Let’s assume a company has a dataset with specific values collected from machinery in an industrial setting. Below is a sample dataset with 10 entries representing machine conditions and their relationship to time-to-failure events.
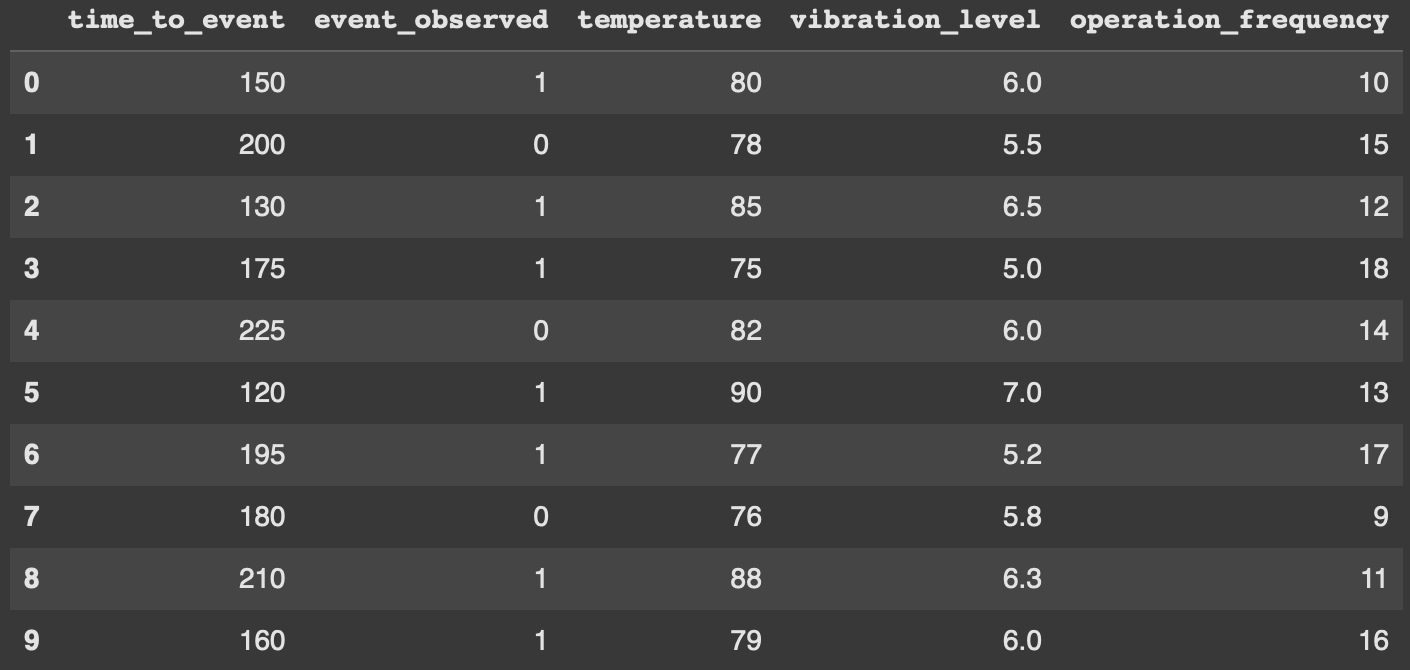
Using this dataset, the Cox Proportional Hazards Model was applied to examine the impact of temperature, vibration level, and operation frequency on equipment failure risk.
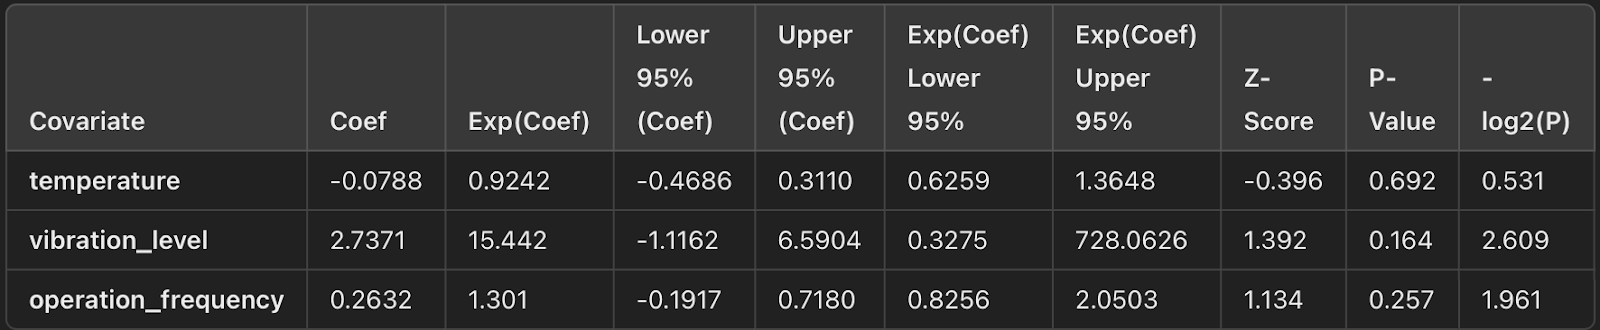
- Coef (Coefficient):
Represents the change in the log hazard ratio for each unit increase in a covariate. Positive coefficients indicate an increased hazard with an increase in the covariate, while negative coefficients indicate a reduced hazard. - Exp(Coef):
The exponentiated coefficient translates the log hazard ratio into a multiplicative effect on the hazard. Values greater than 1 imply an increased hazard, while values less than 1 suggest a decreased hazard. - Confidence Intervals (Lower 95% and Upper 95%):
Provide a range within which the true effect size is likely to fall with 95% confidence. Confidence intervals that span 1 imply the effect may not be statistically significant. - Z-Score:
Indicates how many standard deviations the coefficient is from zero. Larger absolute values suggest stronger evidence against the null hypothesis. - P-Value:
Measures the statistical significance of the coefficient. A p-value below 0.05 typically indicates statistical significance. - -log2(P):
Represents the significance of the covariate on a logarithmic scale. Higher values indicate greater significance.
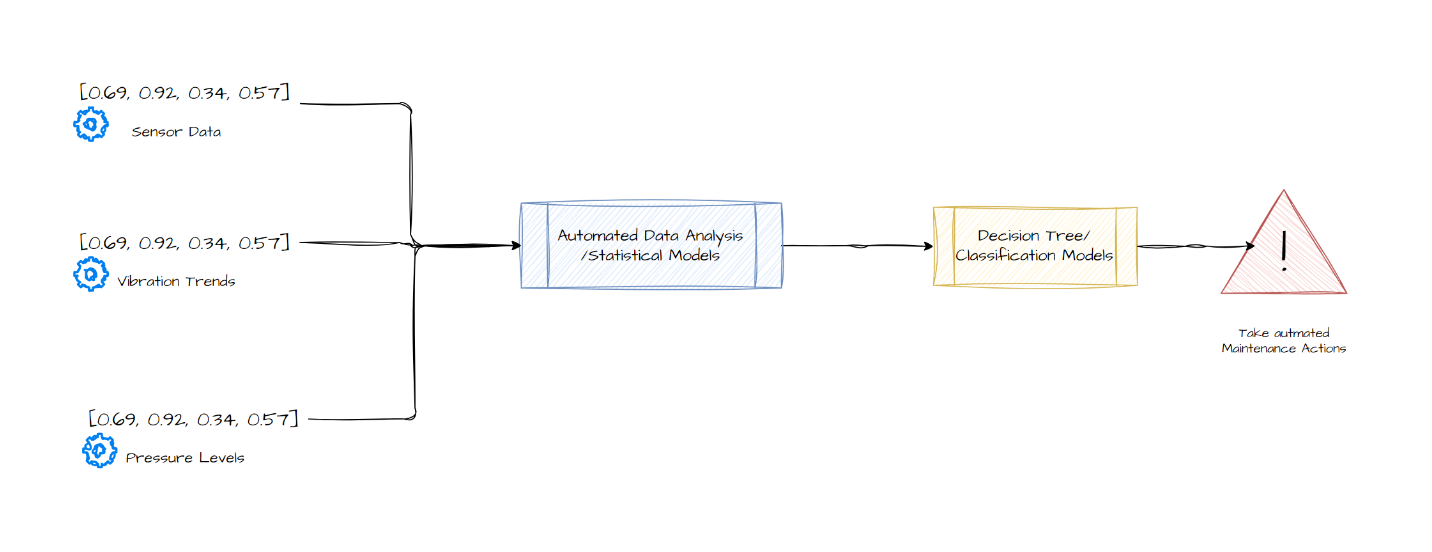
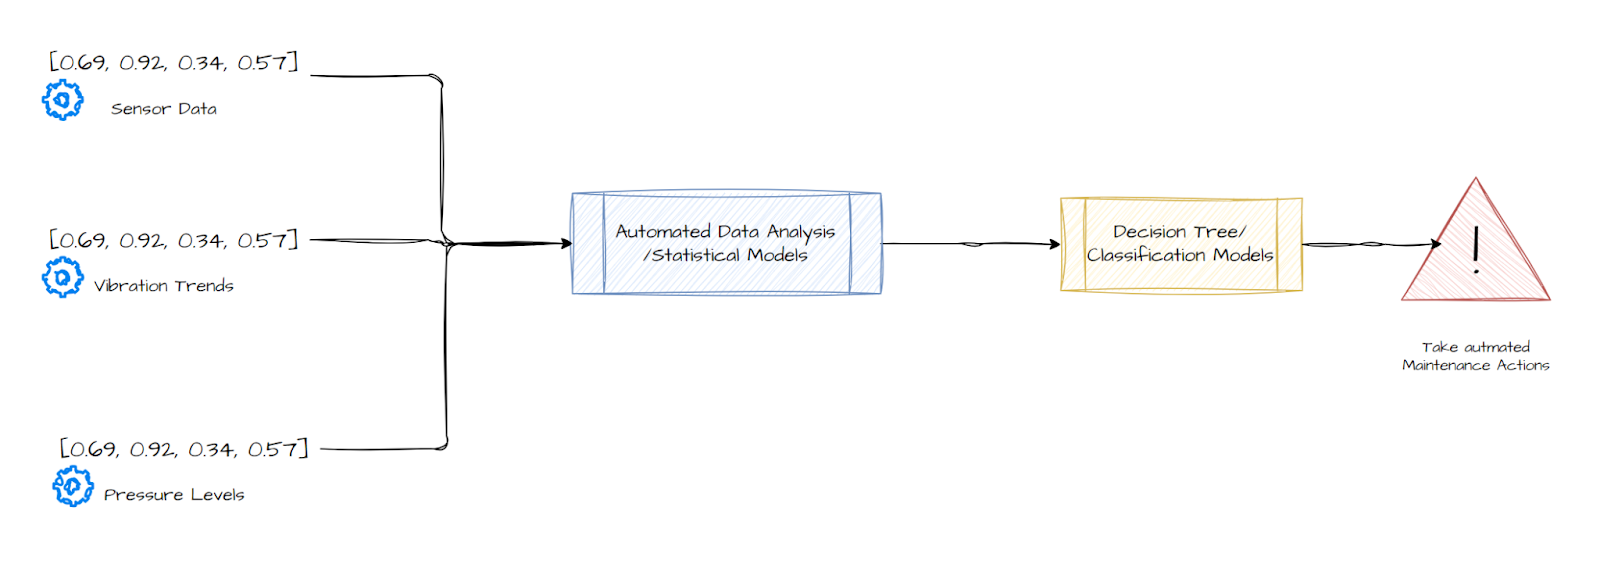
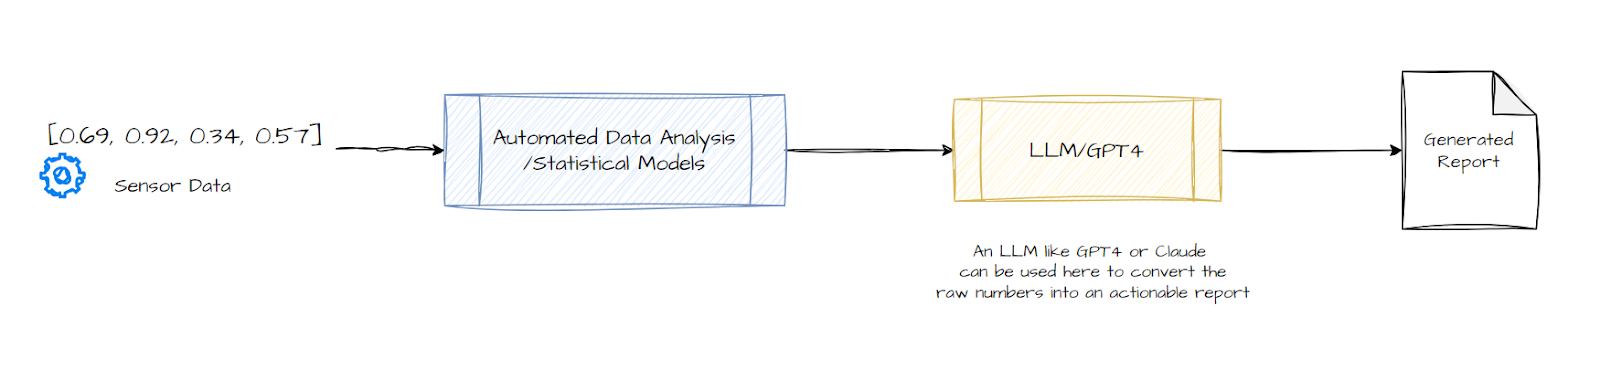
How does AI Powered Maintenance work?
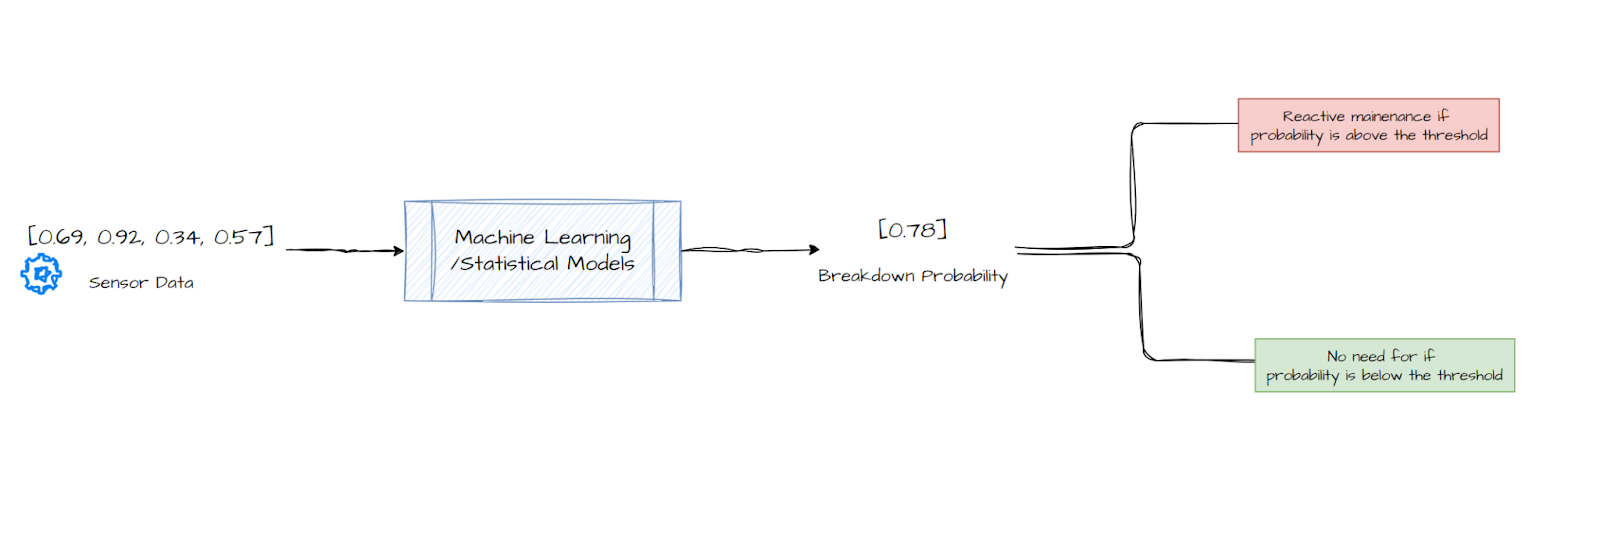
AI-powered maintenance uses advanced technologies like machine learning, IoT sensors, and data analytics to predict and prevent equipment failures. Sensors collect real-time data on parameters such as temperature, vibration, and operational frequency, which are then analyzed by AI algorithms to identify patterns and anomalies. These insights help forecast potential issues and schedule maintenance only when needed, reducing unplanned downtime and optimizing costs. Over time, AI models become more accurate by learning from historical data, enhancing reliability and efficiency across operations.
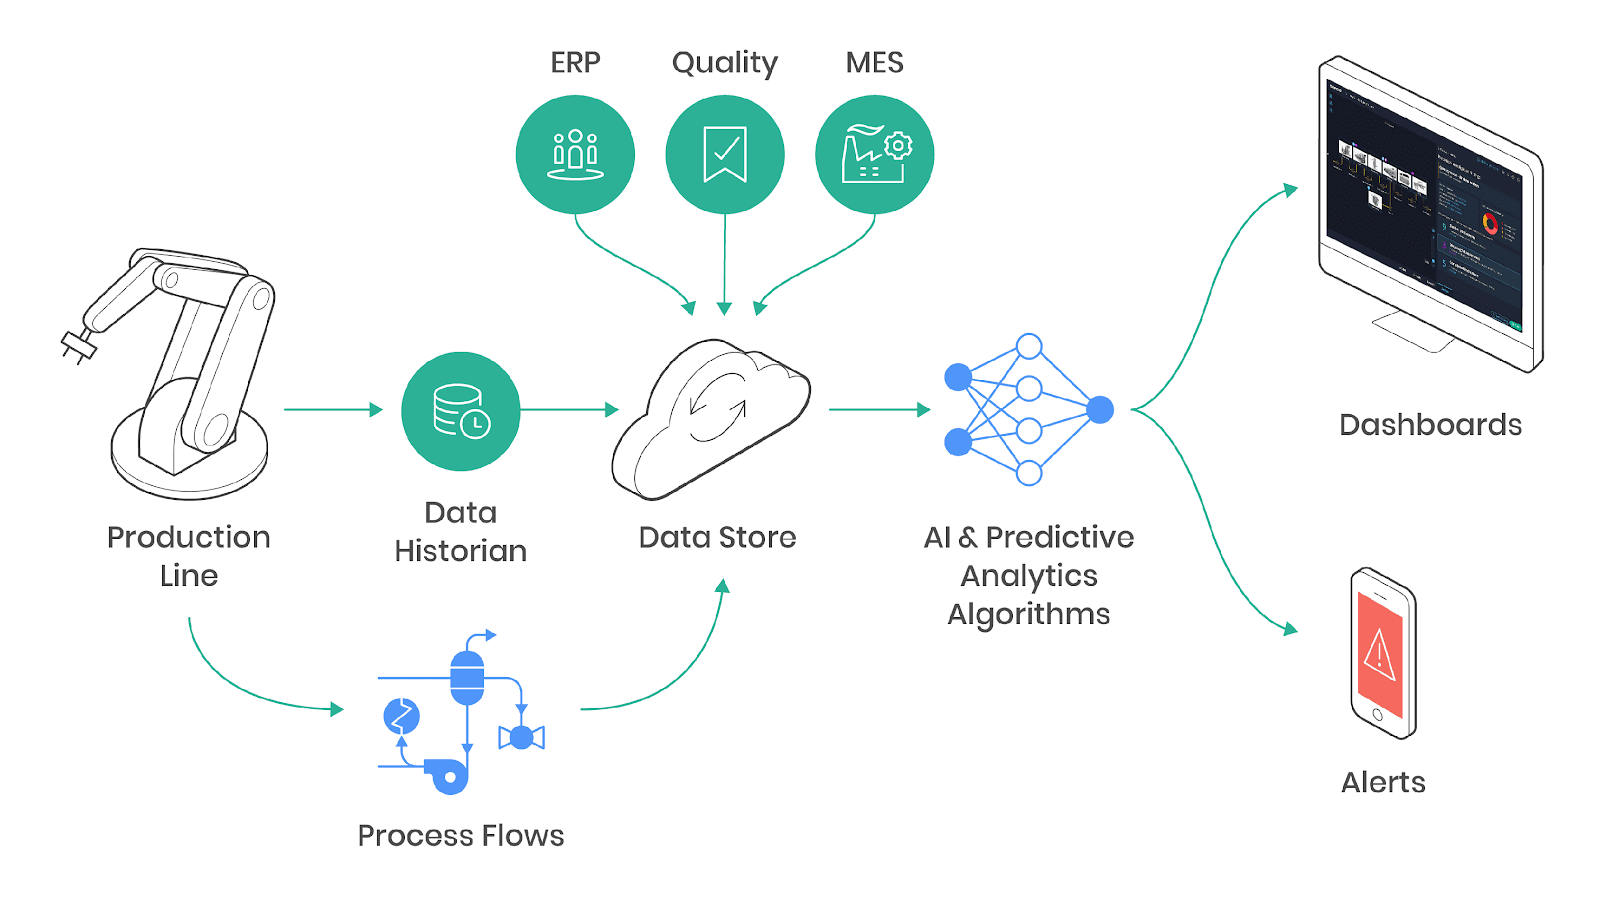
Data Collection and Storage
The process begins with collecting data from various sources, including IoT sensors, operational logs, and historical maintenance records from the equipment manufacturer. This data encompasses crucial parameters like temperature, vibration, rotational speed, and more, which are pivotal for predictive maintenance. For this example, we'll utilize data from a Kaggle dataset to illustrate the process of gathering and storing data effectively.
For this example, we'll utilize a synthetic dataset modeled after an existing milling machine, consisting of 10,000 data points with 14 features. Here are the key attributes of the dataset:
- UID: Unique identifier for each data point (1 to 10,000).
- Product ID: Combines product quality (L, M, H for Low, Medium, High) with a serial number. L represents 50% of products, M 30%, and H 20%.
- Type: Product quality type (L, M, or H).
- Air Temperature [K]: Randomly generated around a mean of 300 K with minor fluctuations.
- Process Temperature [K]: Air temperature plus 10 K, with small variations.
- Rotational Speed [rpm]: Derived from power (2860 W) with added noise.
- Torque [Nm]: Normally distributed around 40 Nm, ensuring no negative values.
- Tool Wear [min]: Increased wear time based on product quality (H/M/L).
- Machine Failure Label: Indicates failure due to one of five modes:
- Tool Wear Failure (TWF): Tool wear exceeds limits.
- Heat Dissipation Failure (HDF): Insufficient temperature difference and low speed.
- Power Failure (PWF): Torque and speed outside acceptable power range.
- Overstrain Failure (OSF): Tool wear and torque exceed thresholds for product quality.
- Random Failures (RNF): Small random chance of failure (0.1%).
If the above failure modes are true, the 'machine failure' label is set to 1. Importantly, it is not transparent to the machine learning method in which specific failure mode caused the process to fail, adding complexity to the predictive task.
Data Preprocessing and Exploratory Data Analysis (EDA)
The data extracted from IoT sensors, operational logs, or manufacturer history data is often prone to outliers, missing values, or data misinterpretations. To ensure the data is accurate, consistent, and suitable for model training, we need to perform data preprocessing and exploratory data analysis (EDA). This is a key step to make the data standardized, remove inconsistencies, and gain insights into the relationships between features.
Handling missing values involves replacing missing data with appropriate fill values such as the mean, median, or forward fill, or removing rows and columns altogether if necessary. Outlier detection and removal can be achieved using statistical methods like the interquartile range (IQR) or by visualizing outliers through boxplots. Data encoding transforms categorical variables, such as 'Type', into binary or numerical formats to make them suitable for machine learning models. Normalization or standardization of numerical features ensures consistency across the dataset, making it easier for algorithms to process and interpret the data effectively.
Feature Engineering
Feature Engineering is a crucial step in the data preparation process for building predictive models. It involves creating new features or modifying existing ones to enhance the predictive power of a dataset. Well-engineered features can make a significant difference in model accuracy and robustness.
Common Feature Engineering Techniques
Feature Creation involves generating new features based on existing ones, often by combining or transforming data to highlight underlying relationships. For example, multiplying torque and rotational speed in a machine dataset can yield a new feature indicative of power output. This technique can capture interactions between variables, enhancing predictive performance.
Encoding Categorical Features transforms non-numeric data (like categories or labels) into a numeric format that machine learning models can understand. Common approaches include one-hot encoding, which creates binary columns for each category, and label encoding, which assigns integer values to categories. Proper encoding ensures categorical variables are effectively utilized during modeling.
Binning converts continuous numerical data into discrete categories or intervals, often making patterns or trends more apparent. For instance, dividing 'tool wear' into 'low', 'medium', and 'high' categories can simplify the modeling process by segmenting data into more interpretable ranges.
Feature Aggregation combines multiple data points or features into a single representative value, such as calculating the mean, sum, or maximum of related variables. This approach is useful when summarizing data over a time period or when consolidating redundant features, ultimately reducing dimensionality and complexity.
Model Training and Evaluation
In predictive maintenance, our goal is to build models that accurately predict machine failures based on various sensor readings and operational parameters. To achieve this, we will use two approaches: a Survival Analysis model (Cox Proportional Hazards Model) and a Machine Learning model (Random Forest Classifier). Survival analysis helps estimate the time until an event occurs, while traditional ML algorithms focus on binary classification for failure prediction.
The Cox Proportional Hazards Model is a popular survival analysis technique that estimates the hazard (or risk) of an event, such as machine failure, occurring at a specific time point, given various covariates. This model is useful for understanding how different factors influence the time to an event.
The Cox Proportional Hazards Model helps in understanding the factors that affect the timing of failures, making it particularly suitable for survival analysis tasks where estimating the time until an event occurs is critical. On the other hand, the Random Forest Classifier provides robust classification predictions, making it well-suited for binary outcomes such as predicting whether a machine will fail or not. By combining insights from both approaches, predictive maintenance models can gain a deeper understanding of machine failure risks and optimize maintenance schedules, ultimately improving operational efficiency and reducing downtime.
Optimize Your Equipment with AI-Powered Predictive Maintenance!
Ready to reduce downtime, cut maintenance costs, and boost operational efficiency? Our AI-driven solutions predict equipment failures before they happen, saving you time and money. Reach out Mercity today, and let's transform your maintenance strategy with cutting-edge predictive technology!